

Thinking in squares
Unlocking LLMs’ hidden spatial superpowers

Testing LLMs on Spatial Reasoning with the Grid Overlay Trick
We’ve been experimenting with large language models’ (LLM) image analysis skills. Previously, we tested their ability to recognize and count items in a scene. We also explored how consistent LLMs were at evaluating images. This time, we wanted to push further: can they handle spatial reasoning?
For instance, I asked Gemini (2.5 Flash) to look at a map and tell me how much of the area was covered in water. The answer: it couldn’t do such calculations.
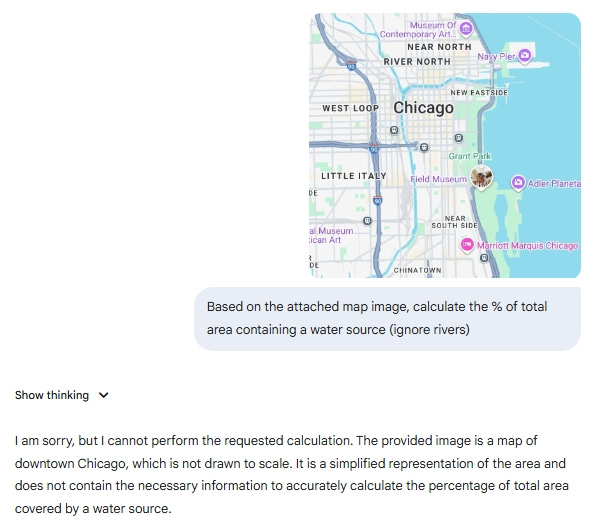
End of story, right? Not so fast.
Borrowing a Trick from Photography
Photographers often use the rule of thirds, a compositional guideline that divides an image into a 3x3 grid. Placing photo elements along these lines tends to make photos feel balanced and pleasing.
I borrowed this concept, but instead of using it for aesthetics, I used it for analysis.
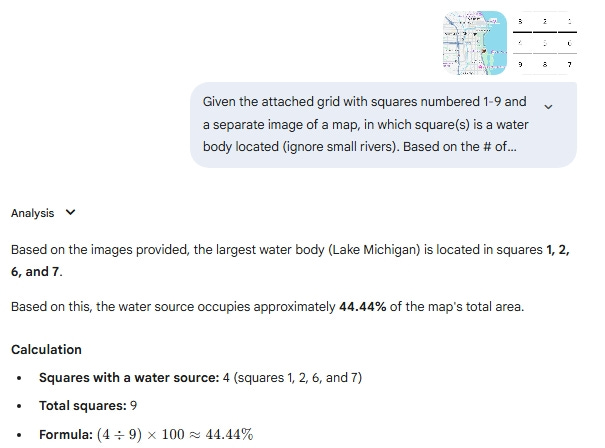
I asked Gemini to overlay a 9-square grid we created onto the map image. Now, instead of estimating percentages over the whole image, the model could reason square by square.
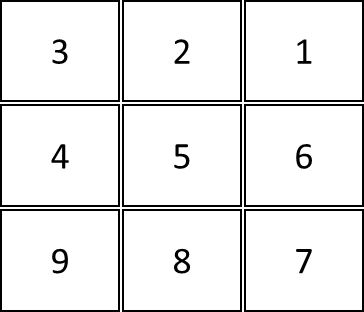
But could it quantify how many grid cells were mostly water? Yes.
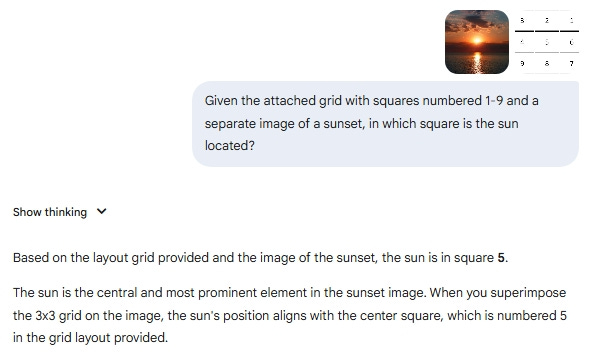
Even better, this technique also allowed the model to pinpoint the location of specific objects in other images - for example, “the sun is in square 5” or “the boat appears in square 8.”
Scaling Up the Grid
Next, I tried our 25-square grid (5x5).
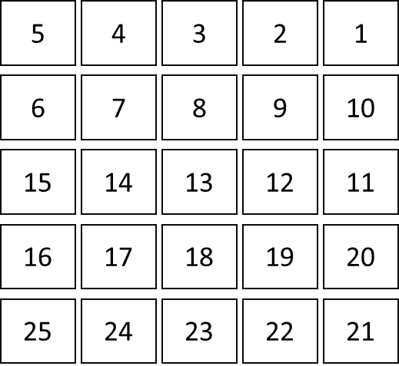
The results improved: finer-grained localization and a narrower calculation. This makes sense. The smaller the grid cells, the more precise the reasoning becomes.
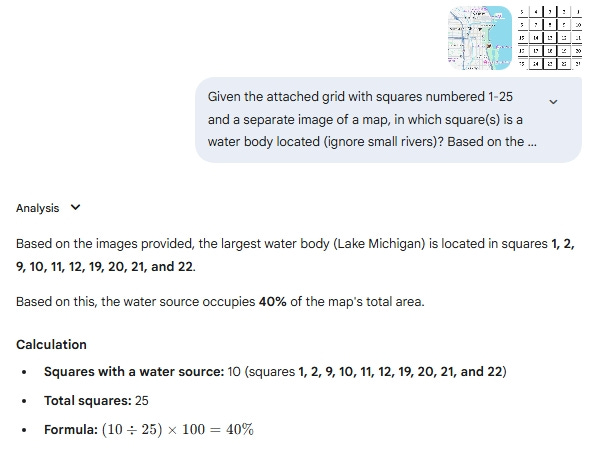
Using the higher-precision grid, we get a different estimate of the water’s share of the surface area (40% vs. 44.44% when using a 9-square grid).
Curious what the ‘actual’ percentage is?
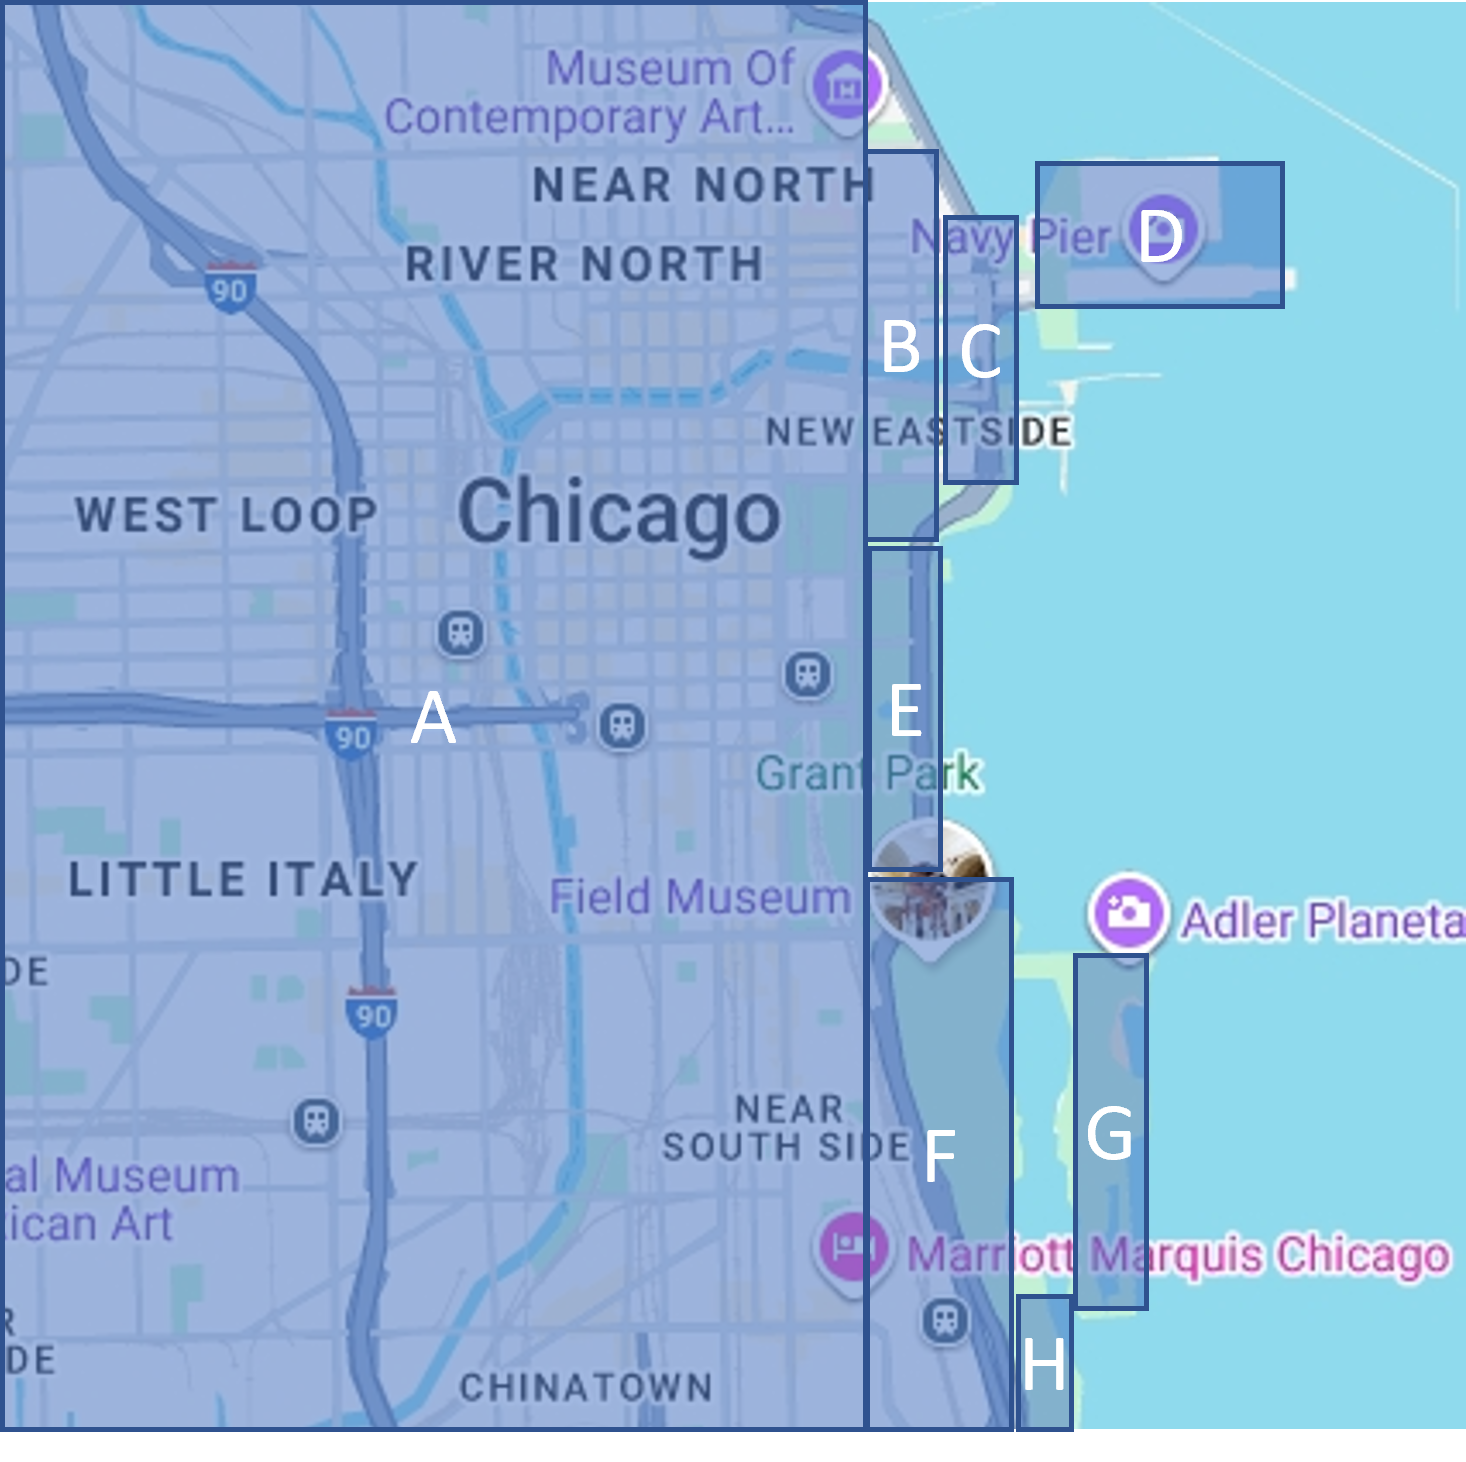
Using the ancient method of exhaustion, we overlaid a series of rectangles with known areas atop the land sections map. By calculating the sum of the areas of the rectangles (math not shown), we were able to approximate the percentage of land (68%) and water (32%).
Encouragingly, the 25-square grid provided a closer approximation (40.0%) compared to the 9-square grid (44.44%). As the method of exhaustion would suggest, finer precision results in more accurate estimation, although it remains to be seen how precise LLMs spatial reasoning can go before breaking down.
Why the Grid Method Works
This approach transforms a fuzzy global problem (“what percent of this image is water?”) into a series of smaller, more concrete ones (“is this particular square mostly water?”). It also mirrors human strategies: when we estimate, we often break things into parts first.
We see the grid method being particularly useful for three scenarios:
Location Pinpointing – Gives unambiguous references (e.g., “tree in square 2”).
Numerical analysis – Supports calculations of area coverage, proportions, or density.
Teaching/Explanation – Provides a universal way to describe an image, even to someone who hasn’t seen it.
Takeaway
LLMs aren’t known for strong spatial reasoning - but the grid overlay trick reveals hidden capabilities. By using a reference tool and breaking an image into smaller, labeled regions, you give the model a lattice for thinking spatially. What once looked impossible (“calculate water coverage”) becomes doable.
It’s a playful method borrowed from art and math, but it transforms vague perception into structured analysis. Download our grid images above and give it a try yourself.
Turns out, the story didn’t end with “the model can’t do it.” It just needed a different lens.
Adventure on.